Structural Monitoring vs Structural Inspection: When to Use Each
Deciding between structural monitoring and structural inspection is rarely a binary choice, but the circumstances that favour each approach are technically distinct. Structural health monitoring (SHM) uses permanently or semi-permanently installed instrumentation to collect time-series data continuously or at high sampling rates, capturing dynamic and quasi-static responses that no single site visit can replicate. Inspection, whether visual or using non-destructive testing (NDT) methods such as ground-penetrating radar, half-cell potential mapping, or impact echo, provides a point-in-time snapshot from a qualified practitioner. The gap between these two paradigms matters practically: it determines whether you detect a problem before failure, at failure, or after the fact.
For asset owners operating in Queensland under development approval conditions, TMR asset management requirements, or environmental authority obligations, the choice also carries compliance implications. A DA condition requiring ongoing deflection monitoring on a retained structure cannot be satisfied by quarterly inspections alone. Conversely, a one-time post-flood condition assessment of a culvert headwall does not require a permanent sensor network. Understanding what each method can and cannot measure -- and at what cost -- is central to defensible asset management.
The construction and infrastructure sectors in Australia have historically defaulted to periodic inspection because the regulatory frameworks around it are mature. AS 3600 (Concrete Structures) and the Queensland Bridge Inspection Manual both reference inspection intervals and condition rating systems. SHM, by contrast, sits within standards frameworks including ISO 13374 (condition monitoring and diagnostics), ISO 13849, and guidance documents from bodies such as the International Society for Structural Health Monitoring of Intelligent Infrastructure (ISHMII). The two approaches are increasingly used together, and understanding where each adds value is the practical question this article addresses.
What Structural Inspection Actually Measures
Visual inspection and NDT provide condition data at a specific point in time. A Level 1 visual inspection identifies surface-observable deterioration: spalling, cracking, efflorescence, section loss, and deformation visible to a trained inspector. Level 2 and Level 3 inspections add close-access methods and instrumented NDT to characterise the depth and extent of defects already identified visually.
The critical limitation of inspection is temporal resolution. If a crack opens and closes cyclically under traffic loading, a static inspection captures its width at the moment of measurement -- which may be its minimum, maximum, or somewhere between, depending on when the inspector arrived. If a steel girder is losing section to corrosion at 0.1 mm per year, the change between inspection cycles may fall within measurement uncertainty. Inspections are well-suited to:
- Condition rating against a defined scale: , such as the Queensland Bridge Inspection Manual's element condition ratings from 1 to 5
- Post-event assessment: following flood, impact, fire, or seismic events
- Confirming sensor anomalies: identified by a monitoring system
- Regulatory compliance sign-off: under Australian building certification requirements
- Targeted NDT: where monitoring data has already localised a region of concern
The practical value of inspection is that it brings human judgement, contextual interpretation, and the ability to test specific hypotheses about visible defects. For many low-risk, low-complexity assets, a well-executed biennial inspection programme under a qualified RPEQ structural engineer remains the correct approach.
What Continuous SHM Actually Measures
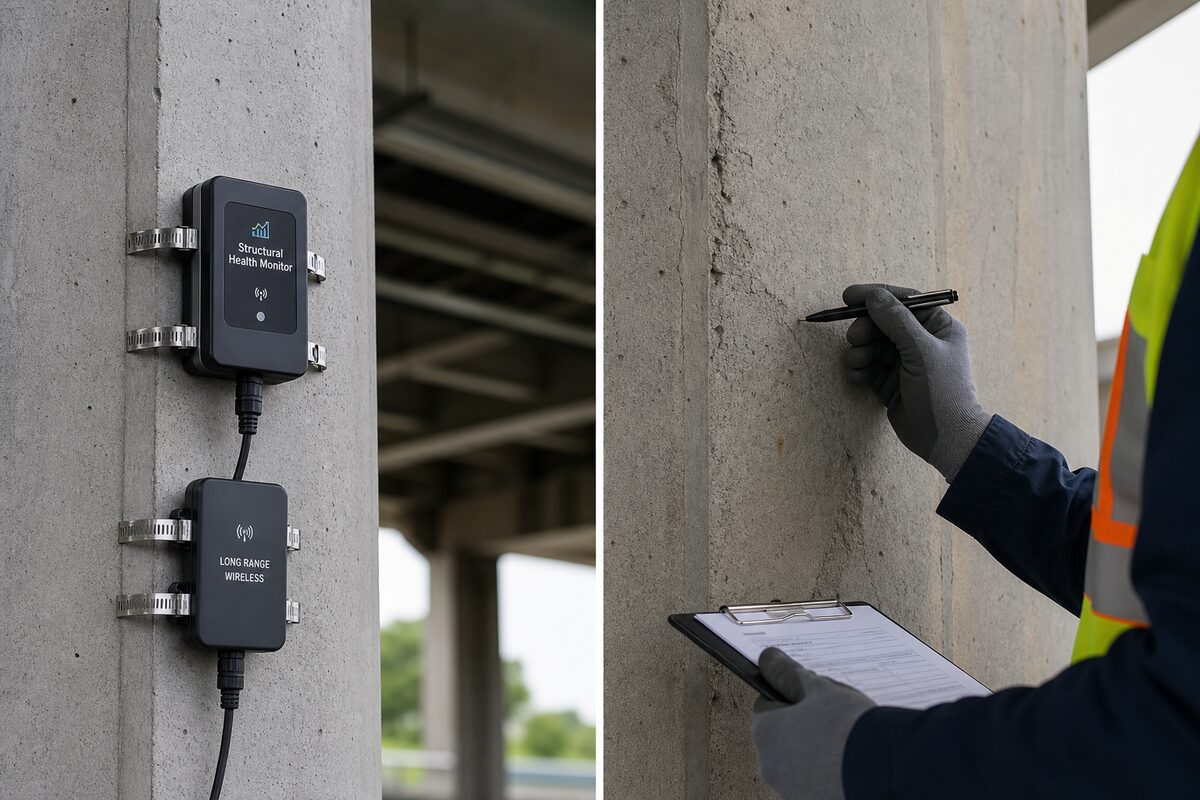
SHM captures the behaviour of a structure over time, not its appearance at a moment in time. A triaxial geophone or MEMS accelerometer installed on a bridge deck records response to every passing vehicle. A vibrating wire strain gauge bonded to a post-tensioned tendon logs load changes that accompany foundation movement. A tiltmeter on a retaining wall records the slow angular drift that precedes instability. None of these processes are visible to an inspector arriving on a quarterly cycle.
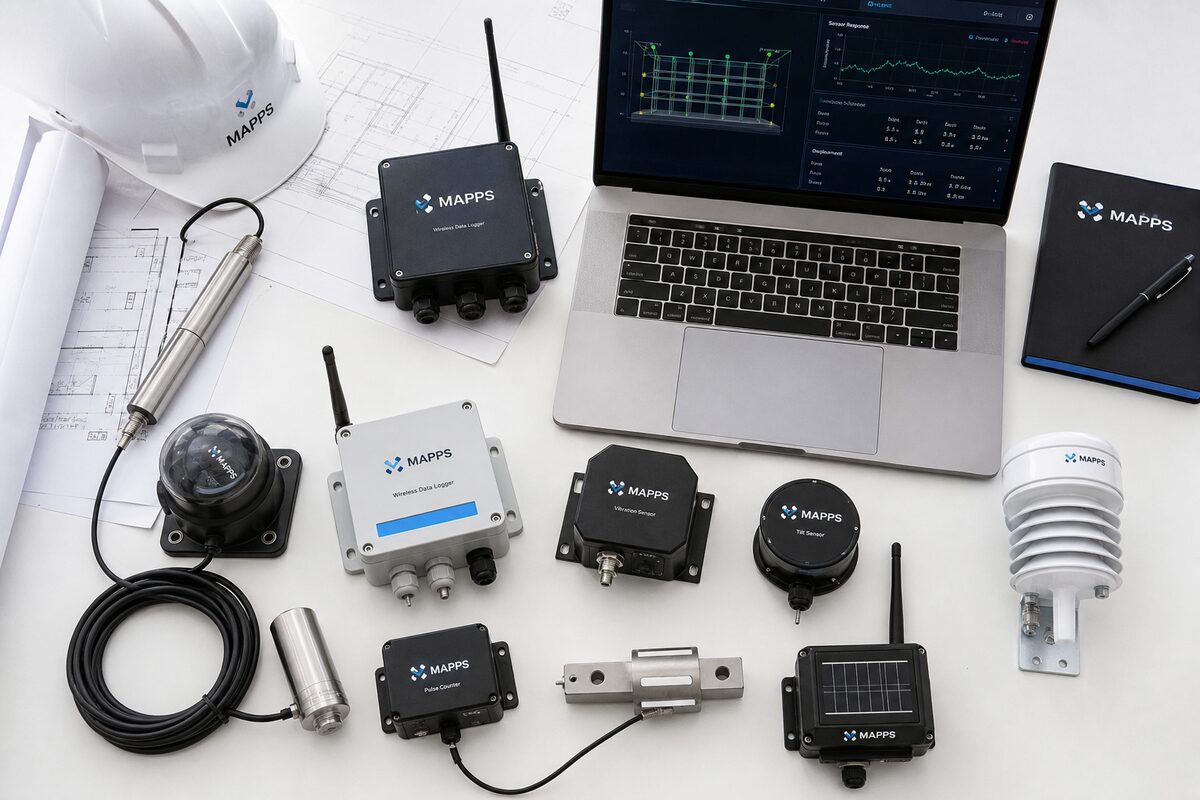
The core measurement parameters in structural monitoring include:
- Vibration and dynamic response: : measured in mm/s peak particle velocity (PPV) or m/s² acceleration, using triaxial geophones or MEMS accelerometers at sampling rates typically from 100 Hz to 10 kHz depending on the frequency range of interest
- Strain and stress: : measured in microstrain (με) using vibrating wire or fibre optic sensors, capturing long-term load redistribution and short-term dynamic loading
- Displacement and deflection: : measured in millimetres using linear potentiometers, total station prisms, or fibre Bragg grating systems
- Tilt and rotation: : measured in degrees or milliradians using biaxial tiltmeters, critical for retaining structures and columns under eccentric load
- Crack width and movement: : measured in millimetres using mechanical or electronic crack gauges, capturing both seasonal thermal cycling and structural distress
SHM is particularly appropriate for:
- Structures under active construction influence: , where AS 2187.2 vibration limits or DIN 4150-3 guideline values apply and real-time PPV data is needed to demonstrate compliance
- Assets with known deterioration mechanisms: that evolve gradually, such as creep in post-tensioned concrete or differential settlement in embankments
- Critical infrastructure: where consequences of undetected failure are severe -- bridges, tunnels, dams, hospitals
- Assets with complex loading environments: that inspection cannot characterise, such as rail bridges under mixed freight and passenger loading
Data Richness: Time-Series vs Snapshot
The difference in data richness between the two approaches is not subtle. A vibrating wire strain sensor logging at 1-minute intervals over a 12-month monitoring period generates 525,600 data points for a single measurement location. An inspector visiting the same location six times over that year generates six condition observations. Neither number is inherently more valuable -- the question is what question each dataset answers.
Time-series data from SHM systems allows detection of trends (gradual drift in baseline readings), seasonality (thermal expansion cycles that mask or amplify structural response), and events (specific loading occurrences that cause anomalous response). Modern SHM data platforms applying approaches aligned with ISO 13374 use statistical process control and machine learning-assisted anomaly detection to flag deviations from baseline behaviour before they become visible defects. For a retaining wall showing 0.3° of tilt over 18 months, continuous tiltmeter data will identify the onset and rate of movement. An inspector arriving after the fact will observe the result but not the progression.
Inspection data, however, carries qualitative information that sensors cannot generate. An experienced RPEQ structural engineer identifies the pattern of cracking that distinguishes alkali-silica reaction from drying shrinkage, or the rust staining profile that indicates which reinforcement layer is corroding. This diagnostic capacity is not replicated by instrumentation alone.
Response Time for Detecting Deterioration
Response time is where the difference between the two methods most directly affects risk. Consider three deterioration scenarios and how each method performs:
Scenario 1: Vibration-induced fatigue cracking in a steel girder
A weld in a steel railway bridge develops a fatigue crack under repeated loading. A continuous strain monitoring system using vibrating wire or dynamic MEMS sensors will detect an anomalous change in strain distribution -- increased strain at adjacent gauges, changed mode shapes in modal analysis -- within hours of the crack reaching a detectable size. An inspection programme on a 12-month cycle may not detect the crack until it is large enough to be visually apparent, which in a fatigue scenario may be close to the critical crack size for fracture.
Scenario 2: Slow differential settlement beneath a heritage building
A heritage-listed masonry building on reactive clay soils begins showing differential settlement at 1 mm per month due to tree root infiltration of a stormwater pipe. A biaxial tiltmeter network logging at 15-minute intervals will detect statistically meaningful deviation from baseline within two to four weeks. A quarterly inspection programme will detect visible cracking after three to six months, at which point several millimetres of differential movement have already occurred.
Scenario 3: Post-blast surface cracking at a residential property near a quarry
Blasting at a nearby construction site produces PPV measurements at the structure. Under AS 2187.2, the allowable limit for structural damage to residential buildings is typically 5 mm/s PPV (frequency-weighted). A real-time geophone array with automated limit alerting flags any exceedance within milliseconds. An inspection arranged after a complaint is lodged records the condition at the time of visit, without the causal PPV data that establishes whether the blasting caused or could have caused the damage.
Cost Comparison: Capital, Operational, and Risk Costs
Comparing the cost of SHM to inspection requires separating capital cost, operational cost, and the cost of risk carried by each approach.
A typical SHM deployment on a medium-complexity structure -- say, a retained cut on a TMR road corridor -- might involve 8-12 sensors (tiltmeters, crack gauges, piezometers), a telemetry unit, cloud data platform, and quarterly reporting by an RPEQ engineer. Installed capital cost typically ranges from $25,000 to $80,000 depending on sensor count and communications infrastructure. Ongoing operational costs including data management and reporting range from $12,000 to $30,000 per year.
A quarterly inspection programme on the same structure, including access, detailed visual inspection, crack mapping, and engineering reporting, might cost $6,000 to $15,000 per visit, or $24,000 to $60,000 annually. In many scenarios, costs are comparable. The difference is in what is purchased: the inspection programme buys four data snapshots per year; the monitoring programme buys continuous behavioural data with real-time alerting.
Risk cost is harder to quantify but not negligible. For a structure adjacent to public infrastructure -- a road, a pedestrian underpass, a building occupied 24 hours per day -- the consequence of missing a deterioration event between inspection cycles includes remediation cost, potential liability, and possible harm to people. For low-consequence rural assets with no public exposure, the risk calculus is different, and periodic inspection may represent appropriate and sufficient diligence.
How Inspection and Monitoring Complement Each Other
The most defensible asset management programmes use both methods in a structured hierarchy. Monitoring provides continuous behavioural data and early warning; inspection provides periodic diagnostic assessment and human-expert interpretation. The integration of the two generates something neither can achieve alone: a condition history that is both quantitatively dense and qualitatively interpreted.
A practical integration model for a complex asset such as a multi-span prestressed concrete bridge might look like this:
- Continuous SHM: : triaxial geophones for vibration, vibrating wire strain gauges on selected tendons and deck sections, biaxial tiltmeters on piers, real-time data feed to a cloud platform with automated alerting at defined threshold values
- Annual Level 1 inspection: : visual inspection against element condition ratings, RPEQ sign-off, reviewed against the SHM baseline data to identify whether any areas of sensor-flagged anomaly show visible change
- Triennial Level 2/3 inspection: : close-access inspection with NDT (half-cell potential, carbonation depth testing, core sampling), used to validate sensor interpretations and update deterioration models
- Event-triggered inspection: : deployed immediately when SHM data shows exceedance of a defined alert threshold, allowing the inspection to target the specific location and mechanism flagged by the data
This model is consistent with the condition monitoring philosophy of ISO 13374, which defines a layered approach to data acquisition, processing, communication, and decision support. It also aligns with Queensland's SARA referral obligations for structures within the State Development Assessment Provisions trigger distances, where documented monitoring and inspection records form part of the regulatory compliance file.
Choosing the Right Approach for Your Asset
The decision framework for asset owners and principal contractors is not complicated when the right questions are asked. What is the consequence of missing a deterioration event? What is the rate at which relevant deterioration mechanisms are expected to develop? Is there a regulatory or contractual obligation for real-time data? What is the public exposure of the asset?
For assets where the answer to any of these questions creates material risk, continuous monitoring is the appropriate primary tool. For assets where deterioration is slow, consequence is low, and access for inspection is straightforward, a well-designed inspection programme remains fit for purpose. For the large category of assets in the middle -- occupied buildings in construction influence zones, heritage structures, infrastructure approaching end of design life -- the combined approach is both technically sound and increasingly expected by regulators and insurers.
The practical output of either approach only has value if it reaches a qualified engineer who can act on it. Monitoring data sitting in a cloud platform without engineering review is not a managed asset. Inspection reports filed without follow-up action are not a managed asset either. The choice of tool matters less than the decision framework that governs how data is collected, interpreted, and acted upon.
At Oculus Technology, our structural monitoring programmes are designed by RPEQ engineers and integrated with inspection workflows from project inception. Whether your asset requires a geophone array for construction vibration compliance, a permanent tiltmeter network for a retained structure, or a combined SHM and inspection programme for an ageing bridge, the deployment is built around the specific risk profile of that asset. Contact us or visit [oculustech.au/services/structural-monitoring](https://oculustech.au/services/structural-monitoring) to discuss your monitoring requirements.
Need monitoring for your project?
Share your site context, approval conditions, and project timeline. We'll respond with a practical monitoring scope within 24 hours.
Request a Scope