IoT Sensors for Construction Monitoring: A Practical Guide
Selecting the wrong sensor for a construction monitoring programme costs more than the sensor itself. It costs credibility when data is challenged in a dispute, costs compliance when a regulator requests calibrated records, and costs money when a network requires redesign mid-project. The choice between sensor types is not purely technical — it intersects with approval conditions, environmental authority requirements, contract obligations to bodies like SARA, TMR, or Brisbane City Council, and the evidentiary standards that apply when third-party assets are at risk. Getting sensor selection right at the planning stage is one of the most consequential decisions a monitoring engineer makes.
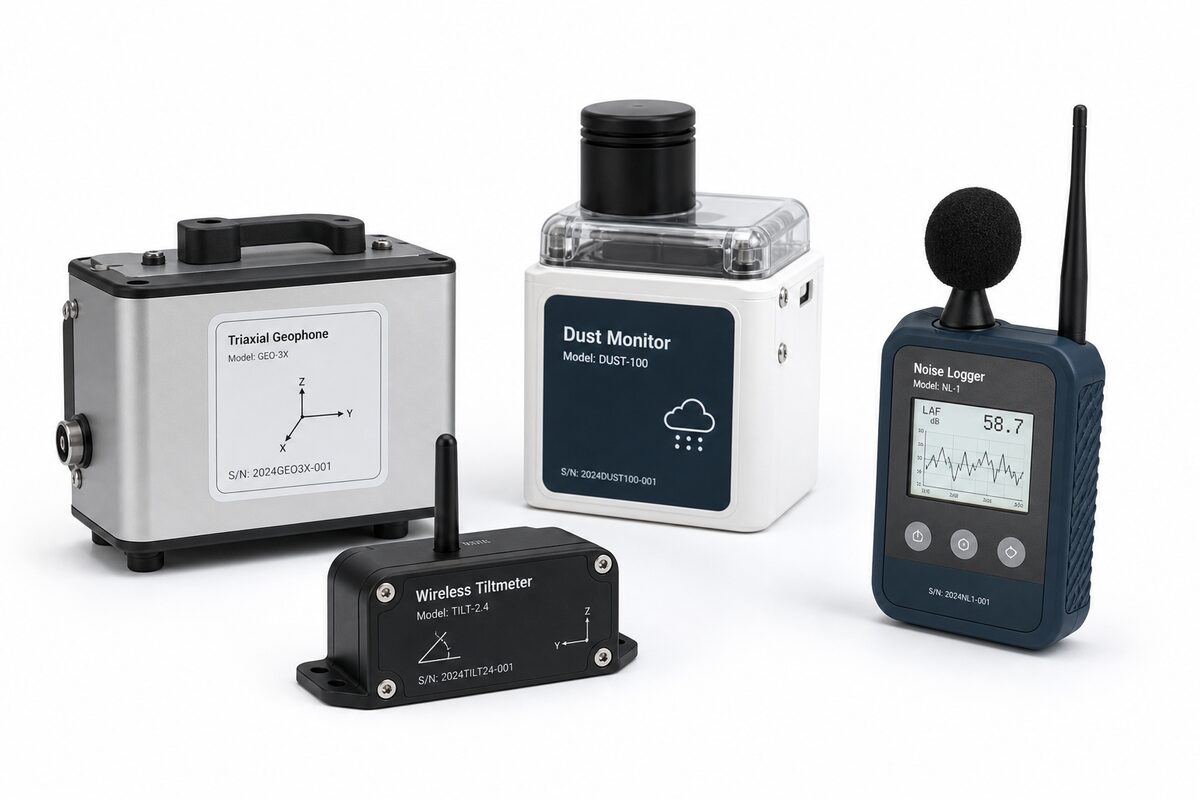
IoT sensors for construction monitoring now span a broad range of measurement principles, wireless protocols, and power configurations. The market has expanded rapidly, and that expansion has introduced genuine technical options alongside marketing noise. This guide works through the principal sensor categories used in construction monitoring across Queensland and broader Australia — vibration, noise, tilt, crack, strain, and dust — and covers the practical decisions around connectivity and power that determine whether a monitoring network performs reliably in the field.
---
Vibration Sensors: Triaxial Geophones vs MEMS Accelerometers
Vibration monitoring at construction sites exists primarily to protect third-party structures and demonstrate compliance with AS 2187.2-2006 (for blasting) and guidance limits published under DIN 4150-3 or BS 7385-2 for continuous and transient vibration from mechanical plant. The measurement unit that matters most in these contexts is Peak Particle Velocity (PPV), expressed in mm/s, measured across three orthogonal axes.
Triaxial Geophones
Geophones are velocity-based transducers. They measure ground or structure particle velocity directly and have been the standard instrument for blast vibration monitoring for decades. Their frequency response — typically 2 Hz to 250 Hz — aligns well with the frequency content of blast and impact events. They produce strong signal-to-noise ratios at low frequencies, require no external amplification in many configurations, and are inherently suited to measuring PPV against AS 2187.2 limits.
For continuous mechanical vibration monitoring (piling, rock breaking, compaction), geophones remain a sound choice when the vibration source is episodic and the primary compliance metric is PPV. Their limitation is dynamic range: in environments with low-amplitude background vibration interspersed with high-amplitude events, some geophone configurations can clip or require range switching.
MEMS Accelerometers
Micro-Electromechanical Systems (MEMS) accelerometers measure acceleration, with PPV derived through integration. Modern MEMS sensors offer flat frequency response from DC to several kHz, wide dynamic range (often exceeding 8g), low power draw, and compact form factors that suit embedded IoT deployments. They are well suited to structural health monitoring applications where both low-amplitude ambient vibration and transient construction events need to be captured on the same channel.
The trade-off is noise floor. Lower-cost MEMS sensors introduce integration drift and noise artefacts at low frequencies, which can affect PPV accuracy when ground velocities are small. High-grade MEMS accelerometers (used in research-grade SHM systems) address this, but at cost. For most construction compliance monitoring against DIN 4150-3 or BS 7385-2 limits — where limit values typically range from 3 mm/s to 50 mm/s PPV depending on structure type and frequency — a well-deployed geophone remains the more defensible choice in a dispute scenario. MEMS sensors are preferred where continuous structural response monitoring, frequency-domain analysis, or integration with multi-parameter IoT platforms is the primary objective.
---
Noise Monitoring: Type 1 vs Type 2 Sound Level Meters
Construction noise compliance in Queensland is governed by conditions attached to development approvals, environmental authorities issued by the Department of Environment and Science (DES), and applicable standards including AS/NZS 1055.1 and the Queensland Government's Environmental Protection (Noise) Policy 2019. Measurement metrics include Leq (equivalent continuous sound level), L10, L90, and Lmax, expressed in dB(A).
Type 1 (Class 1) Meters
Type 1 sound level meters meet the highest accuracy specification under IEC 61672-1. They carry measurement uncertainty of ±1.4 dB across their operational frequency range and are required when monitoring results may form part of a formal complaint investigation, regulatory enforcement action, or legal dispute. When a project operates under a DES environmental authority with noise conditions, or when TMR specifies noise monitoring under an MRTS contract, Type 1 instrumentation is the appropriate standard.
Deploying Type 1 meters in the field requires attention to weatherproofing, windscreen selection, microphone orientation, and calibration records (typically a pre- and post-deployment acoustic calibration with a pistonphone or sound calibrator traceable to NATA standards). Type 1 units in continuous unattended deployment configurations are available and are suitable for IoT integration.
Type 2 (Class 2) Meters
Type 2 instruments have a broader tolerance of ±1.4 dB at reference frequency but higher tolerances at frequency extremes. They are acceptable for indicative monitoring, internal construction management, and early-warning alerting. Where monitoring is being used to trigger operational controls (pausing noisy works during sensitive periods) rather than to generate compliance records, Type 2 instruments are a cost-effective network node.
The critical error is using Type 2 data to defend a compliance position when a regulator or affected party challenges results. If noise monitoring data is ever likely to be used in that context, the network should be built around Type 1 instruments from the outset.
---
Tiltmeters
Tiltmeters measure angular displacement — typically in degrees or arc-seconds — and are applied to monitor differential settlement, retained structure rotation, retaining wall movement, and slope stability. In deep excavation projects adjacent to existing infrastructure, tiltmeters on boundary walls or pile caps provide early detection of movement that might not yet be visible as cracking.
Modern servo-inclinometer type tiltmeters offer resolution to 0.0001 degrees, with biaxial measurement allowing movement vectors to be resolved. For IoT deployment, MEMS-based tiltmeters offer comparable resolution to servo types at lower cost, with lower power consumption and simpler integration. Temperature compensation is essential — an uncompensated tiltmeter in direct sun will produce diurnal drift that masks real structural movement. Instruments should be mounted away from direct radiation or equipped with appropriate shielding.
Tiltmeter data is most interpretable when baseline readings are established over a minimum 7-day pre-construction period, allowing thermal drift profiles to be characterised and real displacement signals to be separated from environmental noise.
---
Crack Gauges and Strain Gauges
Crack Gauges
Crack gauges (crack displacement transducers) measure the change in width of an existing crack or joint. They are installed across visible cracks in adjoining structures, heritage buildings, or infrastructure assets prior to construction commencing. Displacement is measured in millimetres, with typical resolution of 0.01 mm or better.
The primary standard referenced for crack response is DIN 4150-3, which provides guidance on vibration effects on structures and can be used in combination with crack monitoring to demonstrate whether observed crack development correlates with construction activities or predates them. A pre-construction photographic and crack gauge baseline — completed before any plant is mobilised — is essential documentation for managing third-party claims.
Strain Gauges
Vibrating wire strain gauges and electrical resistance strain gauges measure deformation in structural elements — concrete, steel, timber — in units of microstrain (με). They are embedded in concrete during pours or surface-mounted to existing structural members. Vibrating wire types are preferred for long-term monitoring due to their thermal stability and resistance to cable resistance changes over long runs.
Strain gauge data informs assessment of load transfer in piles, bending moments in retaining walls, and stress redistribution during staged excavation. Interpreted against design predictions from finite element models, strain gauge arrays provide real-time validation of structural behaviour. This is particularly relevant where TMR or SARA have imposed monitoring obligations on projects adjacent to rail corridors or state-controlled roads.
---
Dust Monitors: Nephelometers vs Beta Attenuation Monitors (BAMs)
Airborne particulate monitoring during construction controls exposure risk and environmental authority compliance. The relevant metrics are PM10 and PM2.5 mass concentrations, expressed in μg/m³, assessed against limits in Queensland's Environmental Protection (Air) Policy 2019 and guidance in AS 3580.9.
Nephelometers (Optical Particle Counters)
Nephelometers and optical particle counters measure light scattering by airborne particles. They are compact, relatively low-cost, and well suited to real-time IoT deployment in construction fence-line monitoring arrays. They provide continuous PM10 and PM2.5 estimates and can trigger automated alerts when concentrations approach limit values.
Their limitation is that light-scattering estimates of mass concentration are affected by particle composition, size distribution, and relative humidity. Nephelometer readings require correction factors calibrated against gravimetric reference methods to produce defensible mass concentrations. For indicative monitoring and operational control (dust suppression activation, work stoppage triggers), nephelometers are appropriate. They are not suitable as standalone instruments for regulatory compliance reporting without gravimetric validation.
Beta Attenuation Monitors (BAMs)
BAMs measure particulate mass concentration by collecting particles on a filter tape and measuring the attenuation of a beta particle beam. The measurement is gravimetrically traceable and is accepted by DES as a reference-method instrument for regulatory compliance monitoring. Under AS 3580.9.6, BAMs represent the preferred continuous monitoring method for compliance-grade PM10 and PM2.5 data.
BAMs are larger, more expensive, and require regular filter tape replacement and flow rate verification. For projects where an environmental authority specifies particulate monitoring with reportable results, a BAM is the correct instrument. For broader site perimeter monitoring, a hybrid approach — BAM at the primary sensitive receptor direction, nephelometers at secondary fence-line points — provides both compliance-grade data and spatial coverage.
---
Wireless vs Wired Sensor Networks
The decision between wireless and wired sensor deployment is driven by site conditions, data transmission requirements, installation cost, and network reliability requirements.
- Wired networks (RS-485, 4-20mA, Ethernet):: Offer deterministic data delivery, immunity to radio frequency interference, and high data throughput. They are appropriate for permanent or long-term deployments where cabling is practical, or where high-frequency structural health monitoring data (sampled at 100 Hz or greater) must be transmitted continuously. Cable management on active construction sites is a practical challenge requiring protection against plant movement and weather ingress.
- Wireless mesh networks (LoRaWAN, 4G/LTE cellular, Wi-Fi):: LoRaWAN offers low-power, long-range communication suited to battery-operated sensors transmitting low-frequency data (hourly averages, event triggers). 4G/LTE cellular modems provide reliable connectivity where data volumes are moderate and network coverage exists — suitable for most Queensland urban and near-urban construction sites. Wi-Fi is generally unsuitable for construction monitoring due to range limitations and infrastructure dependency.
- Hybrid configurations:: Many production IoT monitoring networks combine short-range wireless (Bluetooth Low Energy or Zigbee) from sensor to a local edge logger, with cellular backhaul from the logger to the cloud. This architecture reduces per-sensor radio power requirements and provides local data buffering when cellular connectivity is interrupted.
---
Power Options for Field-Deployed Sensors
Power supply is frequently the practical constraint that determines sensor placement and network architecture.
- Mains (240V AC):: Reliable and appropriate where site power is accessible. Requires licensed electrical installation and protection against site disturbance.
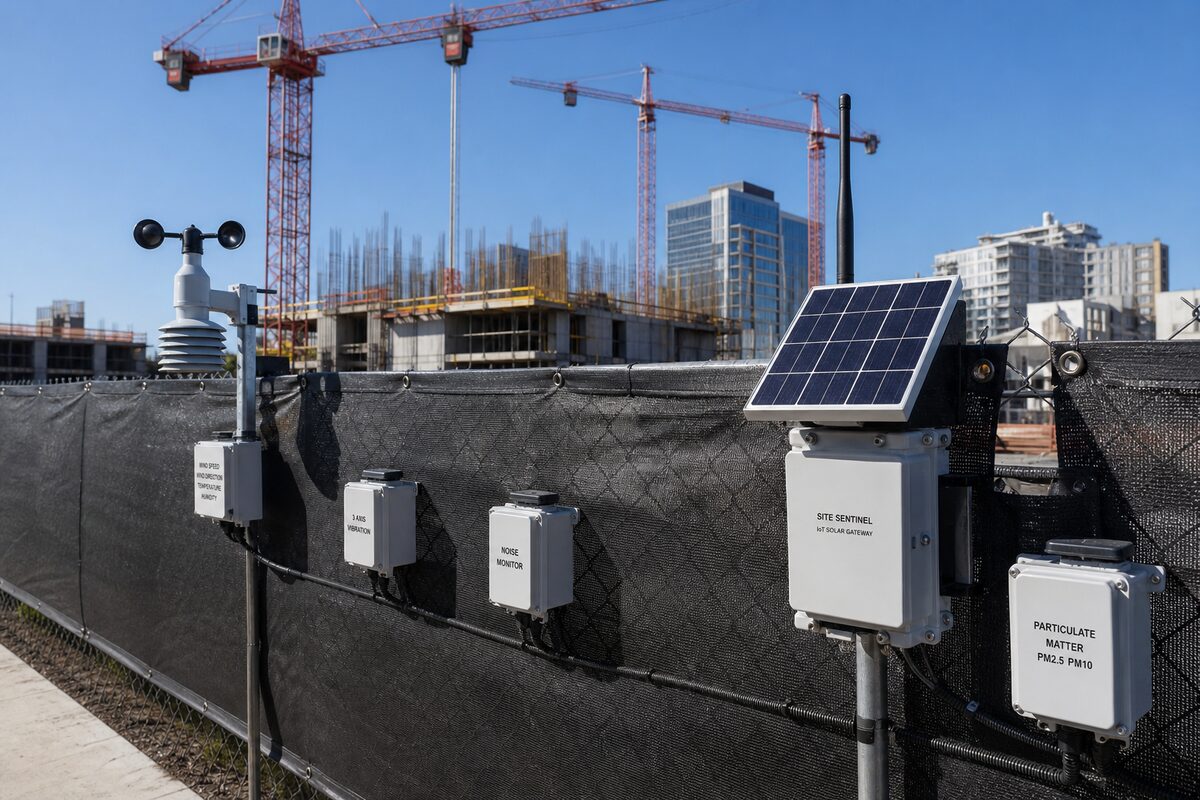
- Solar with battery backup:: The default for remote or temporary monitoring points. System sizing requires assessment of local insolation, sensor power draw, and minimum battery autonomy (typically 5-7 days for Queensland conditions). MEMS-based sensors and LoRaWAN radios are well matched to solar-battery configurations due to their low average current consumption.
- Primary lithium batteries:: Suited to very low-power sensors (tiltmeters, crack gauges reporting at low frequency). Cell life of 2-5 years is achievable with appropriate duty cycle management.
- PoE (Power over Ethernet):: Where wired Ethernet infrastructure is already present, PoE simplifies installation by combining power and data on a single cable run.
---
Data Transmission, Edge Processing, and Platform Integration
Sensor data has limited value without a reliable pathway to interpretation. IoT construction monitoring platforms receive data via cellular or LoRaWAN gateways, apply calibration coefficients and scaling, and present time-series data against configurable alert thresholds. Alert dispatch via SMS and email provides immediate notification when PPV, noise level, tilt, crack width, or dust concentration exceeds a preset limit.
Edge processing — local computation of PPV from raw acceleration or velocity waveforms, Leq integration from audio samples — reduces data transmission volume and enables faster alerting without waiting for cloud-side processing. For vibration monitoring, waveform capture on event trigger (storing the full time-history of each blast or impact) is important for post-event analysis and dispute defence. The monitoring platform should archive raw waveform files, not just peak values, to support retrospective analysis against DIN 4150-3 or BS 7385-2.
---
Matching Sensor Specification to Project Risk and Approval Conditions
The starting point for sensor selection should always be the project's approval conditions, environmental authority, and the consequence of data being challenged. A development approval condition requiring noise monitoring during night works adjacent to a residential zone specifies the outcome — the sensor specification flows from that.
For high-consequence adjacent assets (heritage structures, active rail infrastructure, hospital foundations), instrument grade should be at the top of each category: Type 1 sound level meters, geophone-based vibration monitors with NATA-traceable calibration, servo tiltmeters, and BAMs for dust. For lower-risk fence-line awareness monitoring, a well-designed IoT network of MEMS sensors, Type 2 sound level meters, and nephelometers provides actionable data at reasonable cost.
The mistake to avoid is procuring a monitoring network based primarily on unit cost without mapping sensor capability against the evidentiary requirements of the project. A sensor that cannot produce defensible data when challenged has no value in a dispute — and construction projects adjacent to third-party assets carry dispute risk by default.
Oculus Technology designs and deploys IoT construction monitoring networks across Queensland and beyond, covering vibration, noise, tilt, crack, strain, and dust monitoring with NATA-traceable instruments and cloud-based data platforms. For advice on sensor selection for your project, visit [oculustech.au/services/construction-monitoring](https://oculustech.au/services/construction-monitoring).
Need monitoring for your project?
Share your site context, approval conditions, and project timeline. We'll respond with a practical monitoring scope within 24 hours.
Request a Scope