How to Read a Vibration Monitoring Report: A Guide for Project Managers
Vibration monitoring reports arrive in your inbox during the busiest phases of a construction project: piling, rock breaking, compaction, demolition. For most project managers, the data inside those reports represents a compliance obligation they need to understand but rarely have time to decode. Misreading a report, or not reading it at all, creates real exposure. A missed exceedance, an unacknowledged threshold approach, or an incorrect assumption about what the numbers mean can translate into community complaints, regulatory scrutiny, and in the worst cases, disputed liability for structural damage to adjacent buildings.
This guide explains the key components of a construction vibration monitoring report in plain terms. It is written for principal contractors, project managers, and site supervisors who receive these reports regularly and need to act on them with confidence, without necessarily having an engineering background. Understanding what each section tells you, and what your obligations are in response, is a practical skill that protects both the project and the surrounding community.
What PPV Means and Why It Matters
Peak Particle Velocity, expressed in millimetres per second (mm/s), is the standard metric for reporting ground-borne vibration from construction activities. It represents the maximum velocity at which a point on the ground, or on a structure, moves during a vibration event. PPV is used because it correlates well with the way structures respond to dynamic loading: too much movement too quickly, and building elements experience strain.
Australian practice draws primarily on AS 2187.2 for blasting and on the German standard DIN 4150-3 and British standard BS 7385-2 for general construction vibration. DIN 4150-3 is widely referenced in development approval conditions and environmental authority requirements across Queensland and the rest of Australia. It sets PPV limits that vary depending on building type and vibration frequency, typically ranging from 2.5 mm/s to 50 mm/s depending on the structure classification and exposure duration.
When you see a PPV reading in a report, it is not an average. It is the peak value recorded during a single vibration event, extracted from the waveform trace. A reading of 1.8 mm/s from a rock breaker operating adjacent to a residential dwelling is close to the typical 2 mm/s limit applied to sensitive receivers under DIN 4150-3 short-term guidance. That proximity matters. A reading of 0.3 mm/s from the same operation is well within safe limits. The number alone tells you the severity, but the frequency and waveform context tell you what is actually happening in the ground.
Dominant Frequency and Why It Changes the Limits
Vibration frequency, measured in Hertz (Hz), is the second most important value in your report. Frequency describes how many oscillation cycles occur per second. Low-frequency vibration (below 10 Hz) is more damaging to structures than high-frequency vibration at the same PPV, because structures tend to respond more strongly to vibrations that approach their own natural frequencies, which for most buildings fall in the 2 to 10 Hz range.
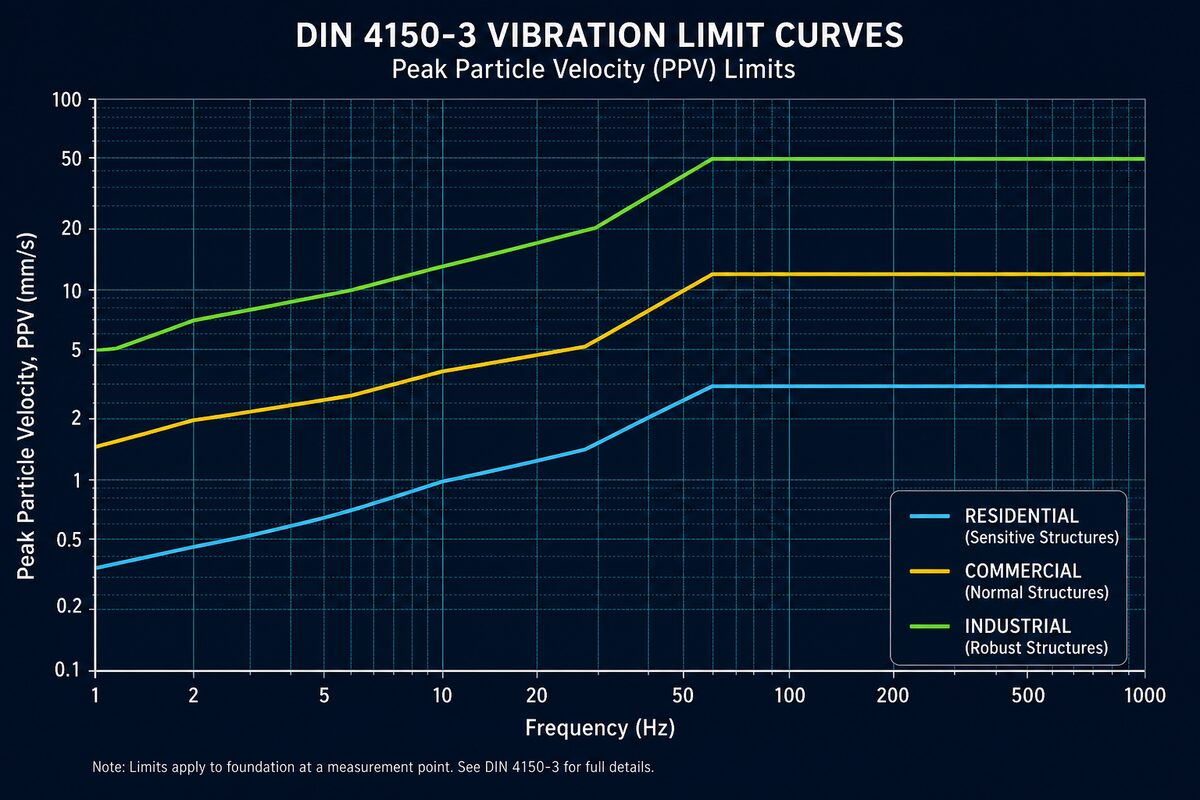
This frequency dependency is the reason DIN 4150-3 uses sliding limit curves rather than a single fixed threshold. At 5 Hz, the allowable PPV for a residential building may be as low as 2.5 mm/s. At 40 Hz, the same building type may tolerate 10 mm/s or more. A good vibration monitoring report will display frequency data alongside PPV so you can see where each event sits relative to the appropriate threshold for that frequency band.
In practice, rock breaking and vibratory compaction tend to produce lower dominant frequencies (5 to 20 Hz) compared to impact driving or demolition works. If your report consistently shows events with dominant frequencies below 10 Hz, the applicable limits are tighter, and the margin between measured values and thresholds needs closer attention.
Reading a Waveform Trace
A waveform trace is the graphical output of a triaxial geophone or MEMS accelerometer over a short time window, typically capturing several seconds around a recorded event. It plots particle velocity (mm/s) on the vertical axis against time (seconds) on the horizontal axis, with three separate traces representing vibration in the transverse (X), longitudinal (Y), and vertical (Z) directions.
When reviewing waveform traces in a report, look for the following:
- Amplitude envelope:: The height of the waveform peaks shows how the vibration intensity builds and decays. A sharp, high peak followed by rapid decay is typical of an impact event such as a pile hammer strike. A sustained, relatively uniform amplitude pattern suggests continuous plant operation such as a compactor.
- Directionality:: Comparing the three axes tells you where the dominant energy is travelling. If the longitudinal trace consistently shows the highest PPV, the vibration source is likely in a direct line from sensor to receiver along that axis.
- Frequency character:: Tightly spaced, rapid oscillations indicate higher frequencies. Slow, wide oscillations indicate lower frequencies. This gives a visual cross-check against the reported dominant frequency value.
- Background noise floor:: The baseline amplitude before the event shows the ambient vibration level. A low noise floor means the monitoring equipment is capturing only construction-related vibration. A high, noisy baseline may indicate traffic or other sources are influencing the data.
Waveform traces are primarily for the monitoring engineer to interpret, but as a project manager, understanding their basic shape helps you assess whether an event in the report is a true construction vibration spike or an instrument artefact.
Time History Plots: Seeing the Whole Shift
Where a waveform trace zooms in on a single event, a time history plot shows PPV readings across an entire monitoring period, typically a full working shift or a 24-hour period. Each recorded trigger event appears as a vertical bar or dot on the plot, with time on the horizontal axis and PPV on the vertical axis. Threshold lines are usually overlaid so the compliance picture is immediately visible.
Time history plots are one of the most useful sections of the report for project managers because they show patterns:
- Clustering of high readings: at a specific time of day can be cross-referenced against the works programme to identify which activity or plant is responsible.
- Isolated spikes: in an otherwise low dataset may indicate a one-off event such as an unexpected impact or equipment malfunction rather than a systematic issue.
- Progressive increases: across successive days, with readings trending toward the threshold, are an early warning that works are moving closer to the receiver or that plant operation intensity is increasing.
Time history data is also what regulators and development assessment authorities will examine if a complaint is made. Reports that clearly document the time, PPV, and frequency of every triggered event provide the evidentiary foundation for defending a project's compliance position before bodies such as SARA, DES, or BCC.
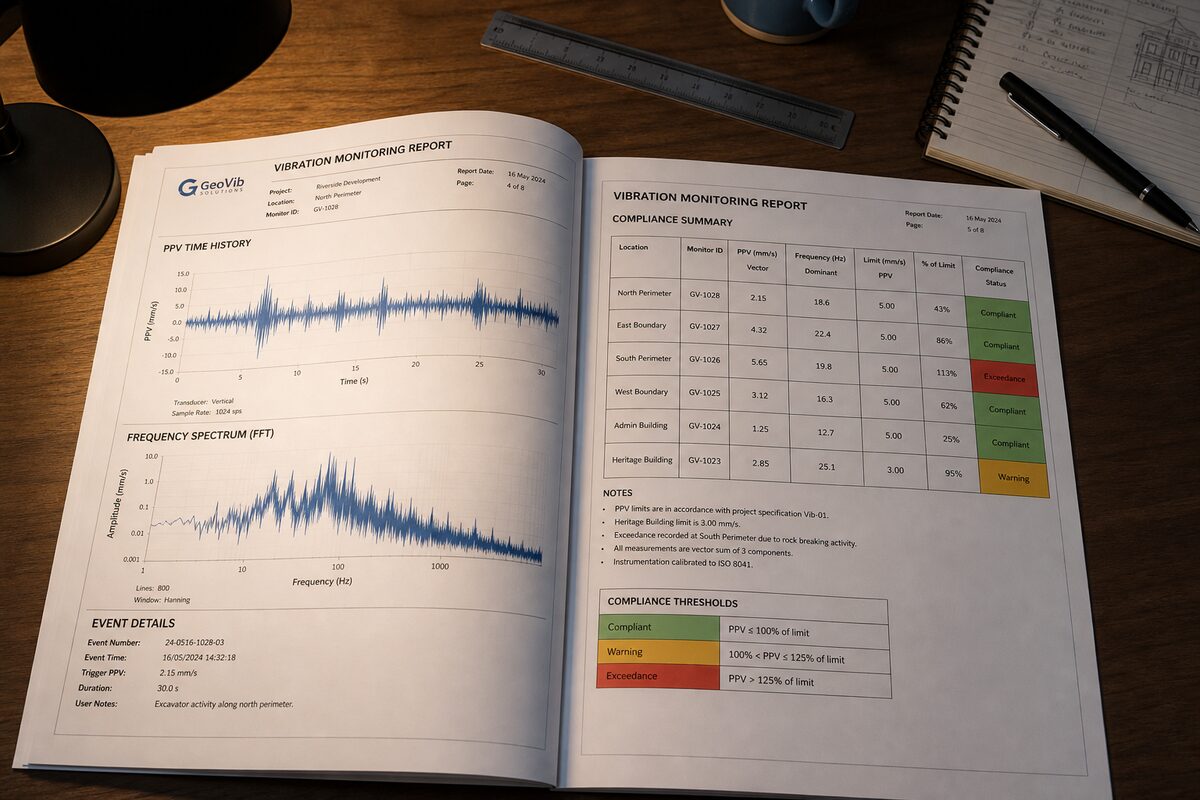
Threshold Comparison Tables
Most professional vibration monitoring reports include a threshold comparison table that summarises triggered events against the applicable limits. A typical table includes the event timestamp, peak PPV (mm/s), dominant frequency (Hz), the applicable threshold at that frequency, and a compliance status indicator.
Reading this table is straightforward once you know what to look for:
- Green or compliant status:: The measured PPV is below the applicable threshold. No action is required, but retain the record.
- Amber or approach status:: The measured PPV has reached a defined approach level, commonly set at 75 to 80 percent of the threshold. This is a precautionary trigger, not an exceedance. It signals that works should be reviewed before the limit is breached.
- Red or exceedance status:: The measured PPV has exceeded the applicable threshold. This requires documented action.
The thresholds in these tables should be explicitly referenced to the governing standard or approval condition. If a report lists a threshold of 5 mm/s but does not state whether this is derived from DIN 4150-3, BS 7385-2, AS 2187.2, or a specific development approval condition, ask your monitoring provider to clarify. Thresholds applied without clear reference to their source are not defensible.
Exceedance Notifications: What Happens Next
When an exceedance is recorded, most environmental authority conditions and monitoring management plans require an exceedance notification to be issued within a defined timeframe, often 24 hours, to the relevant authority and in some cases to affected receivers. The monitoring report will typically flag exceedances both in the threshold comparison table and in a dedicated exceedance summary section.
As a project manager, your obligations when an exceedance notification is issued are generally:
- Document the works activity: occurring at the time of the exceedance, including plant type, method, and proximity to the monitoring sensor.
- Review the monitoring management plan: to confirm whether works must be suspended, modified, or reviewed by a suitably qualified engineer before continuing.
- Notify the relevant authority: in accordance with the approval condition timeframe. In Queensland, this typically means notifying DES or the administering authority named in the environmental authority, and potentially SARA if the site is subject to referral conditions.
- Implement a corrective action: such as changing the construction method, increasing standoff distance, reducing plant energy, or installing vibration isolation measures.
- Record the corrective action: in writing and retain it as part of the project's compliance documentation.
A single exceedance, properly documented and corrected, rarely becomes a regulatory issue. An undocumented exceedance, or a pattern of repeated exceedances without corrective action, is where projects encounter serious compliance exposure.
What the Numbers Mean for Adjacent Structures
Translating PPV readings into actual risk to adjacent structures requires understanding what types of damage can occur and at what thresholds. DIN 4150-3 defines three building categories with corresponding limits. Category I covers commercial and industrial buildings, Category II covers residential buildings and structures of similar construction, and Category III covers particularly sensitive buildings including heritage structures, buildings with known defects, or structures with long-span elements.
For a standard residential building (Category II) under DIN 4150-3 short-term vibration guidance:
- Below 2.5 mm/s at low frequency:: Negligible risk of cosmetic damage. The building fabric is not being loaded outside normal environmental variation.
- 2.5 to 5 mm/s at low frequency:: Increased monitoring attention warranted. Cosmetic cracking in plaster or render is theoretically possible in buildings already in poor condition.
- Above 10 mm/s at any frequency:: Structural assessment of the adjacent building by a registered professional engineer is advisable before works continue.
Pre-existing condition surveys, which document cracking, settlement, and defects in adjacent buildings before works commence, are essential context for interpreting these numbers. A PPV of 3 mm/s reported in isolation means something different if the adjacent building already has 20 mm wide cracks from pre-existing foundation movement.
Actions to Take When Limits Are Approached
Approach-level readings, typically flagged at 75 to 80 percent of the applicable threshold, are the most important section of the report for proactive project management. They are the point at which adjustments are still straightforward. Consider the following responses when approach-level readings appear:
- Hold a short tool-box discussion: with the plant operator and site supervisor to confirm working distances and methods are consistent with what was assumed when limits were set.
- Request a real-time monitoring review: from your monitoring provider to confirm the sensor position is still representative of the nearest sensitive receiver.
- Check whether works have moved closer: to the monitoring array or whether a new construction phase has introduced higher-energy plant than was originally scheduled.
- Review the vibration management protocol: in your site environmental management plan and confirm all personnel responsible for compliance are aware of current readings.
Treating approach-level readings as informational rather than actionable is a common mistake. The approach threshold exists precisely to create a window for adjustment before an exceedance occurs.
Conclusion
A vibration monitoring report is a compliance and risk management document, not a formality. The PPV readings, frequency data, waveform traces, time history plots, and threshold comparison tables each contribute a specific layer of information about what your construction activities are doing to the surrounding environment. Reading that information correctly, and responding to it at the right time, is what keeps a project on the right side of its environmental authority conditions and its obligations to adjacent property owners.
If your current reports are difficult to interpret, lack clear threshold references, or do not include the event-level detail needed to reconstruct what happened during any given shift, that is a gap worth addressing with your monitoring provider. At Oculus Technology, our vibration monitoring reports are structured specifically so that project managers can read them without engineering support, while still providing the technical depth that RPEQ review and regulatory submissions require. Learn more about our vibration monitoring services at [oculustech.au/services/vibration-monitoring](https://oculustech.au/services/vibration-monitoring).
Need monitoring for your project?
Share your site context, approval conditions, and project timeline. We'll respond with a practical monitoring scope within 24 hours.
Request a Scope